Kyoto City
The whole of Kyoto City, matching Kinki REINS' Kyoto City area. Landscape and height rules limit new supply, and the gap between the centre and outer wards is large.
At a glance
- Market phase: Plateau (high prices, easing demand) (adjustment pressure 36 / 100, as of 2026-09; confidence mid)
- Resale condominiums: median ¥455k per m², +5.7% year on year (2026 Q2, MLIT)
- Official land prices (residential, 1 January 2026): +3.5% on average
Details are in the sections below.
Market phase (data as of 2026-09)
Plateau (high prices, easing demand) (adjustment pressure 36 / 100, confidence mid, as of 2026-09)
Adjustment pressure is our own score built from inventory, transaction counts, closing prices and the gap between asking and closing prices (0-20 overheating, 20-40 plateau, 40-60 early correction, 60-80 correction under way, 80-100 declining). How it works: Methodology.
What the score is made of
| Indicator | Sign of adjustment |
|---|---|
| Gap between asking and closing prices | Weak |
| Closed sales, year on year (3-month) | Moderate |
| Closing price per m², year on year (3-month) | None |
| Consecutive months of falling closing prices (3-month) | Moderate |
Each indicator is scored 0-3 (none, weak, moderate, strong) and weighted into the adjustment pressure. Figures from private sources such as REINS are shown only to members under their terms.
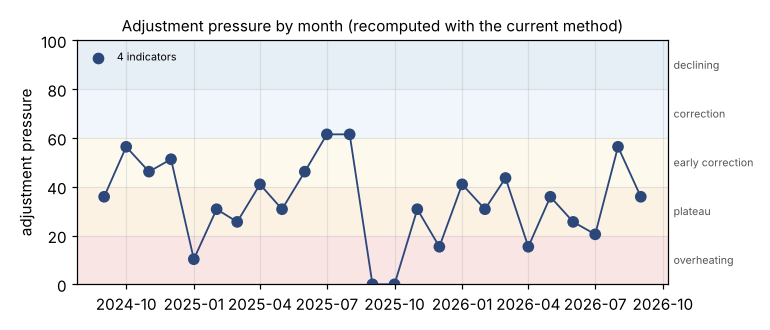
Adjustment pressure recomputed for past months with the current method, using only data up to each month (months with at least three indicators; larger dots mean more indicators). Fewer indicators were available in the past, so the line can jump when one is added.
What to watch: How the central six wards and the outer five move differently.
Resale condominium closing prices (MLIT)
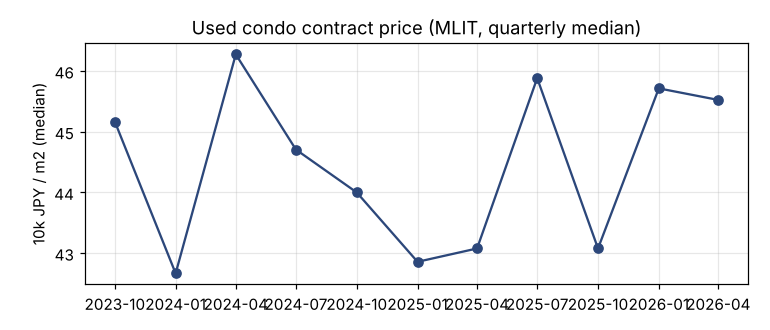
Price per m² in units of ¥10,000 (万円). Quarters with fewer than 10 closings are not shown.
| Quarter | Median price per m² (¥10k) | Closings |
|---|---|---|
| 2024 Q3 | 44.7 | 381 |
| 2024 Q4 | 44.0 | 440 |
| 2025 Q1 | 42.9 | 505 |
| 2025 Q2 | 43.1 | 454 |
| 2025 Q3 | 45.9 | 421 |
| 2025 Q4 | 43.1 | 449 |
| 2026 Q1 | 45.7 | 487 |
| 2026 Q2 | 45.5 | 418 |
- Year-on-year change in median price per m²: +5.7% (2026 Q2)
By floor plan (resale condominiums, last 4 quarters)
2025 Q3 to 2026 Q2. Floor plans with fewer than 10 closings are not shown. "S" (service room) is not counted as a room.
| Floor plan | Closings | Median price (¥10k) | Median per m² (¥10k) | Median size (m²) | Per m², year on year |
|---|---|---|---|---|---|
| Studio / 1K / 1DK | 238 | 1,050 | 40.0 | 25.0 | -9.1% |
| 1LDK | 178 | 3,000 | 61.6 | 50.0 | +3.9% |
| 2 rooms (2K-2LDK) | 491 | 3,100 | 48.3 | 65.0 | +3.6% |
| 3 rooms (3K-3LDK) | 743 | 3,000 | 42.9 | 70.0 | +3.7% |
| 4 rooms or more | 125 | 3,100 | 36.7 | 85.0 | -10.8% |
Houses and land (MLIT)
Transaction prices from MLIT's survey of registered sales. Prices in ¥10,000. Quarters with fewer than 20 deals are not shown.
| Quarter | Median house price (¥10k) | House deals | Houses under ¥10m | Median land price per m² (¥10k) |
|---|---|---|---|---|
| 2025 Q3 | 3,200 | 451 | 17.5% | 28.3 |
| 2025 Q4 | 3,200 | 443 | 16.9% | 24.6 |
| 2026 Q1 | 2,800 | 405 | 19.0% | 24.0 |
| 2026 Q2 | 2,500 | 257 | 24.1% | 28.9 |
Official land prices (Chika Koji, MLIT)
Prices of standard sites as of 1 January each year (published in March). The change is the average for sites that continue from the previous year.
| Year | Use | Median (¥ per m²) | Change | Sites |
|---|---|---|---|---|
| 2024 | Commercial | 555,500 | +6.4% | 104 |
| 2025 | Commercial | 615,000 | +10.1% | 104 |
| 2026 | Commercial | 665,000 | +10.0% | 104 |
| 2024 | Residential | 198,000 | +2.4% | 219 |
| 2025 | Residential | 211,500 | +3.1% | 212 |
| 2026 | Residential | 217,000 | +3.5% | 212 |
From the centre outwards
Adjustment pressure for each part of the city, centre first, with the first month of the current run at 40 (early correction) or above. Values are recomputed for past months with the current method (how to read this).
-
Central Kyoto 6 Wards 67 (40 or above since Sep 2026) → Kyoto City 36 (not yet at 40)
-
The correction has reached 1 of 2 areas so far; the outer areas are still below 40.
Frequently asked questions
Are apartment prices in Kyoto City falling?
According to MLIT closing prices, the median price per m² in 2026 Q2 was ¥455k, +5.7% year on year — prices have not started to fall. Prices tend to move later than inventory and sales, so check the market phase on this page as well.
What phase is the Kyoto City property market in?
Our call is Plateau (high prices, easing demand) (adjustment pressure 36/100, as of 2026-09): prices are high, and supply and demand have started to loosen (more inventory, fewer sales).
Is now a good time to buy in Kyoto City?
We do not give buy or sell recommendations. The market phase is a guide to overall supply and demand, not to the price or future value of any single property.
This service uses the API of the MLIT Real Estate Information Library, but the timeliness, accuracy and completeness of the information provided are not guaranteed. (このサービスは、国土交通省不動産情報ライブラリのAPI機能を使用していますが、提供情報の最新性、正確性、完全性等が保証されたものではありません。) Other sources: Data sources.
Figures are medians of individual transactions and change with the mix of what sold. Regime labels are our own interpretation, not investment advice.